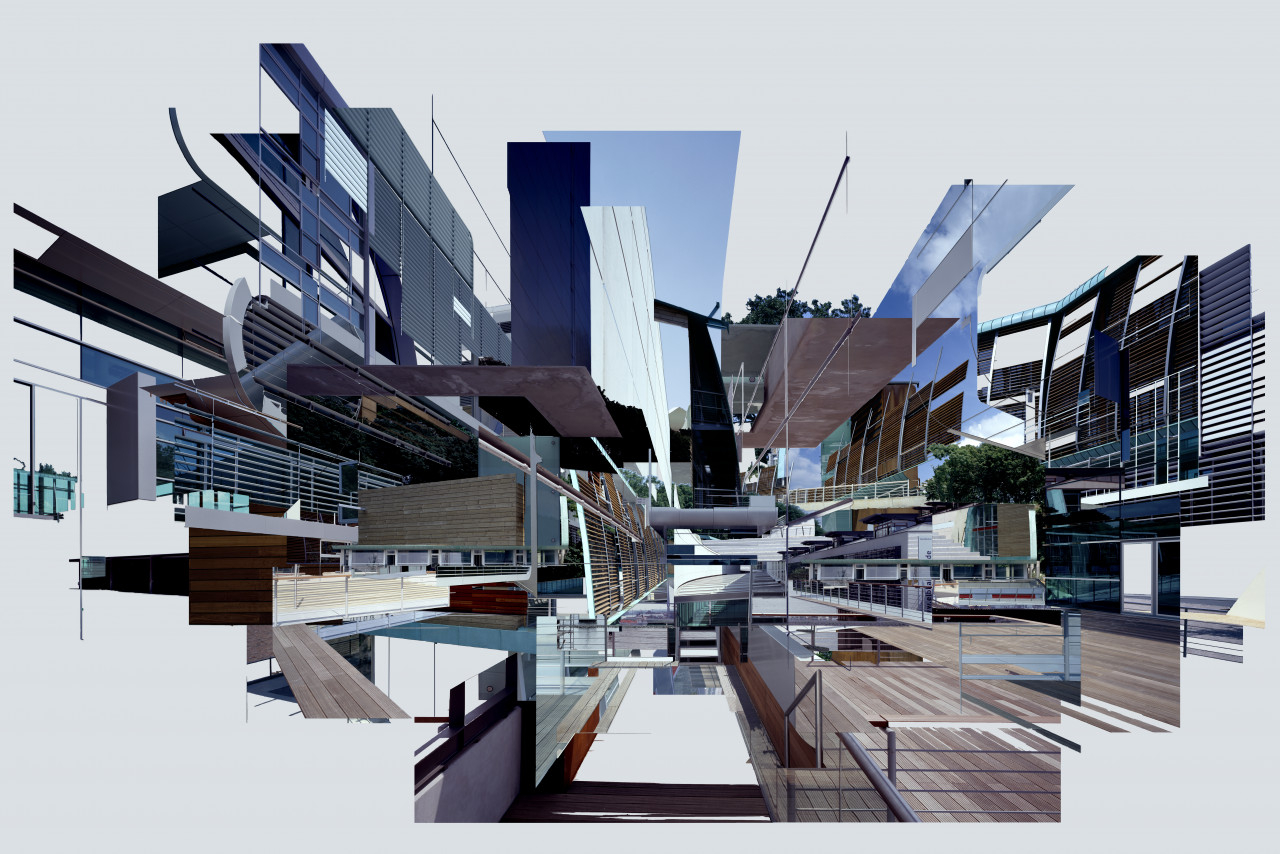
Keyword: Visualization 47

×

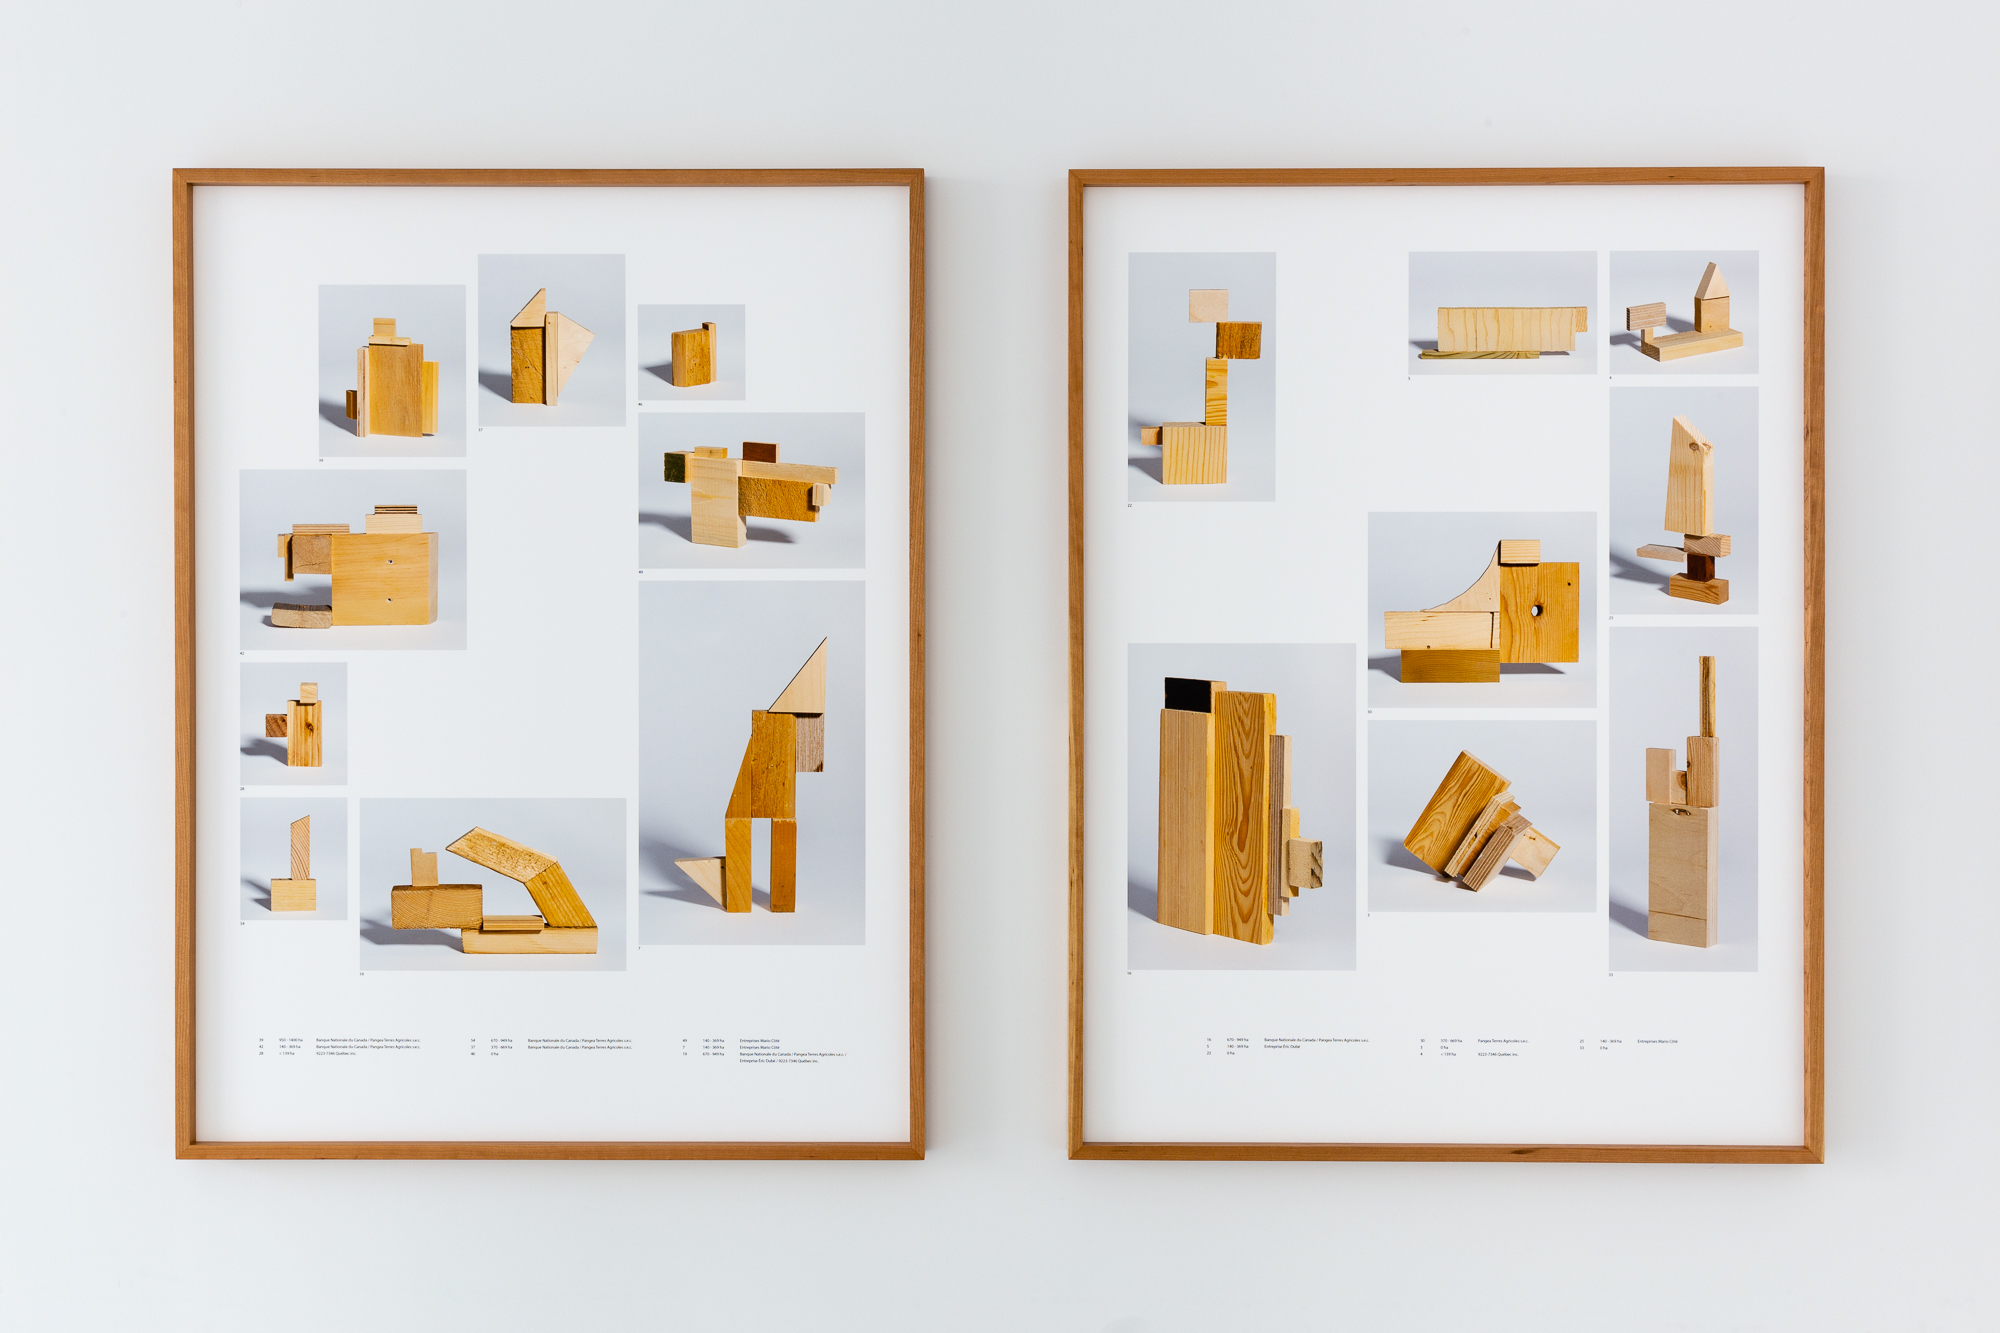
Richard Ibghy & Marilou Lemmens


http://www.ibghylemmens.com/nobredhectares.html


http://www.ibghylemmens.com/Revolutions_of_Capitalism.html

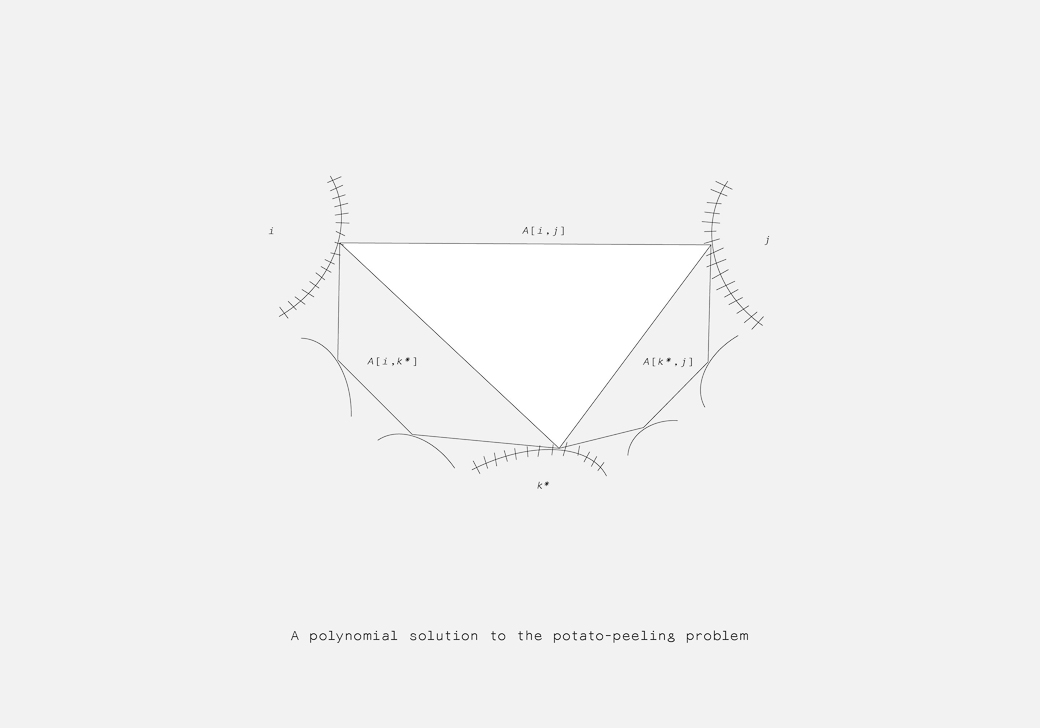
Artist duo, working a lot with diagrams, chart-like installations and visualisations on economic, social, labour issues.
http://www.ibghylemmens.com/

GRADATIONs / Daihei Shibata

“When we gradate the boundaries between two polarized things, the two become smoothly connected. By blurring the various boundaries, we can find complexity, diversity, and richness of information.”

https://vimeo.com/497879805

24 Times / Gysin-Vanetti

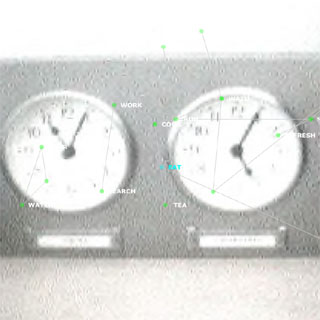
“A collection of twentyfour variations on the theme ‘clock’. […] Each of these twentyfour clocks shows time in a different form. The result is a sequence of numbers, letters or punctuation marks animated in different ways.”

https://24times.gysin-vanetti.com/

Grafoscopio

“Grafoscopio is a moldable tool for interactive documentation and data visualization, that is being used in citizen, garage & open science, reproducible research, (h)ac(k)tivism, open & community innovation, domain specific visualization and data journalism …”

https://mutabit.com/

Scientific paper with black hole in original size

What if Planet 9 is a Primordial Black Hole? (Scholtz, Unwin)

Time Based Text / Jaromil, Jodi

“A software application that records performance time of written text and vehicles it as additional information: it saves and reproduces every single action during the composition of a text, so that an additional dimension of emphasis in written communication can be circulated.”

http://aaaan.net/jaromil-tbt-time-based-text/
http://rg42.org/wiki/tbt (example)

OpenDataCam

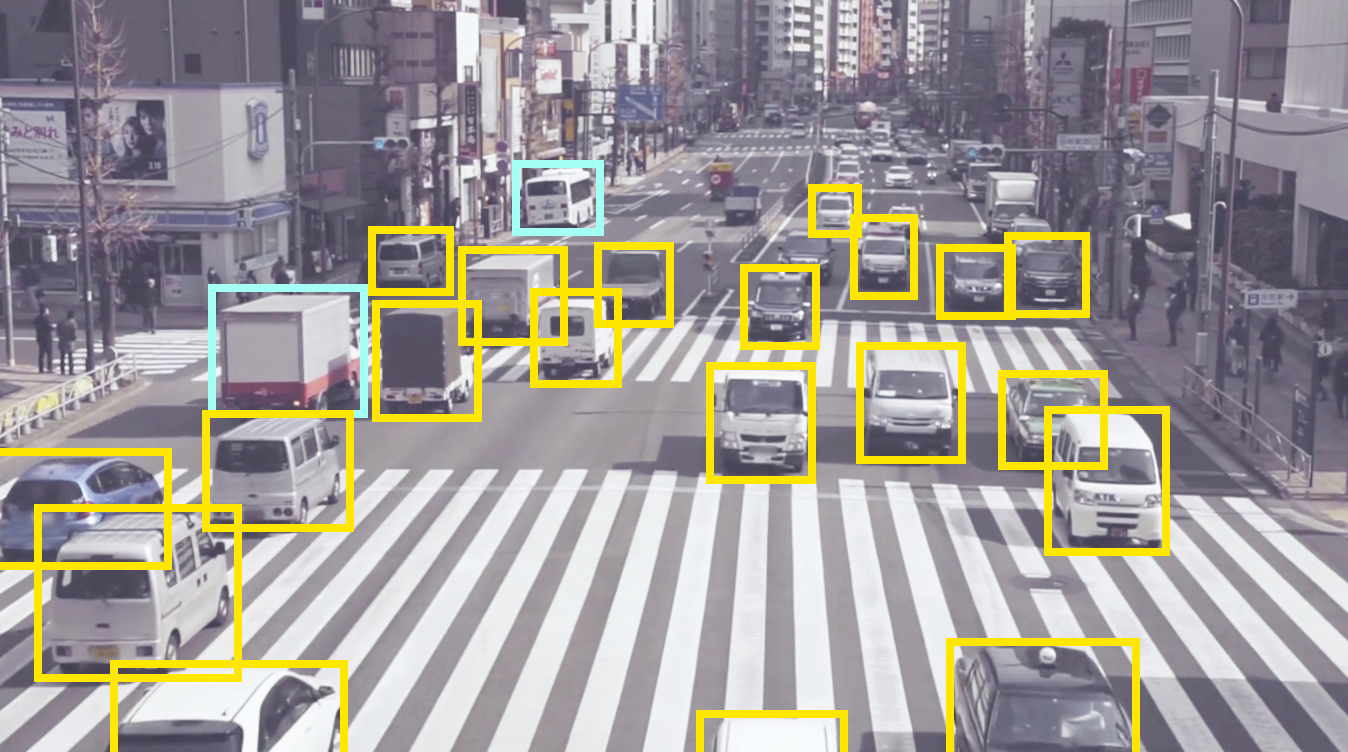
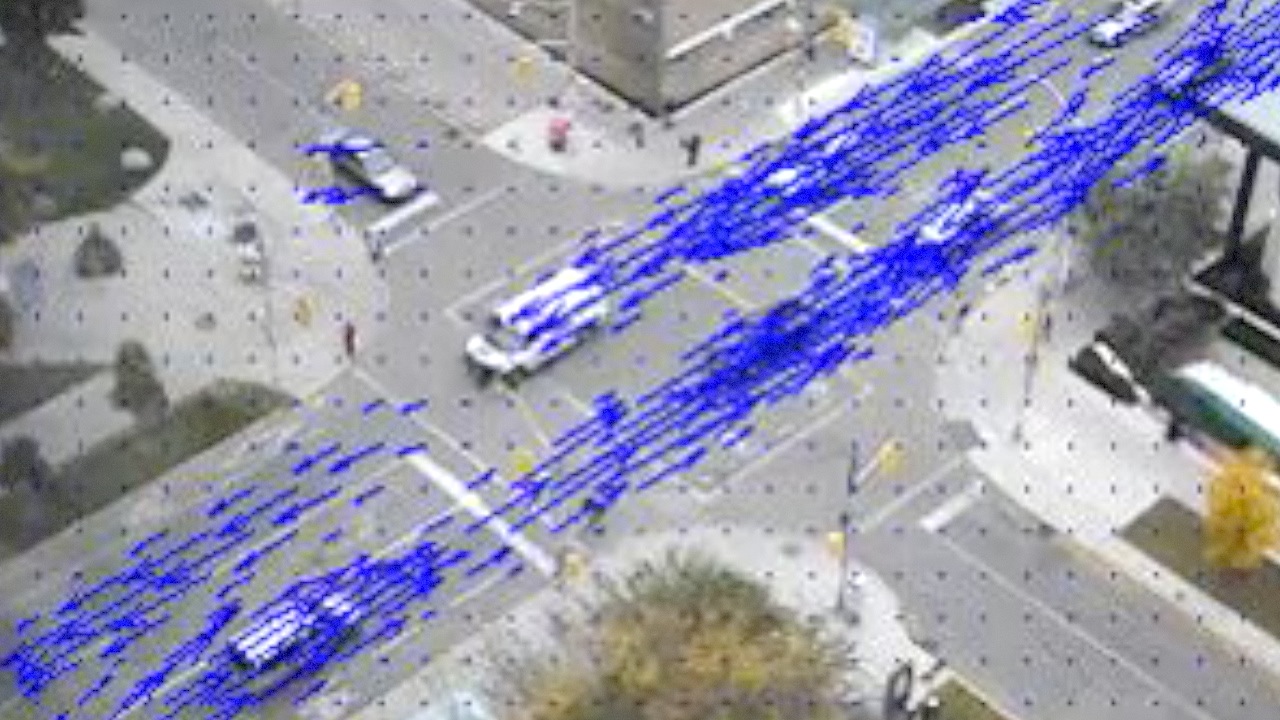
“‘OpenDataCam’ is a tool that helps to quantify the world. … With computer vision OpenDataCam understands and quantifies moving objects. The simple setup allows everybody to become an urban data miner.”

https://www.move-lab.com/project/opendatacam/

Popup Trombone / Matthew Rayfield

http://matthewrayfield.com/goodies/popup-trombone/

PANE: Programming with visible data / Joshua Horowitz

“PANE is a live, functional programming environment built around data-visibility. In PANE, all intermediate values are visible by default, and you construct a program by acting on these concrete values.”

http://joshuahhh.com/projects/pane/

Declassifier – Humans of AI / Philipp Schmitt

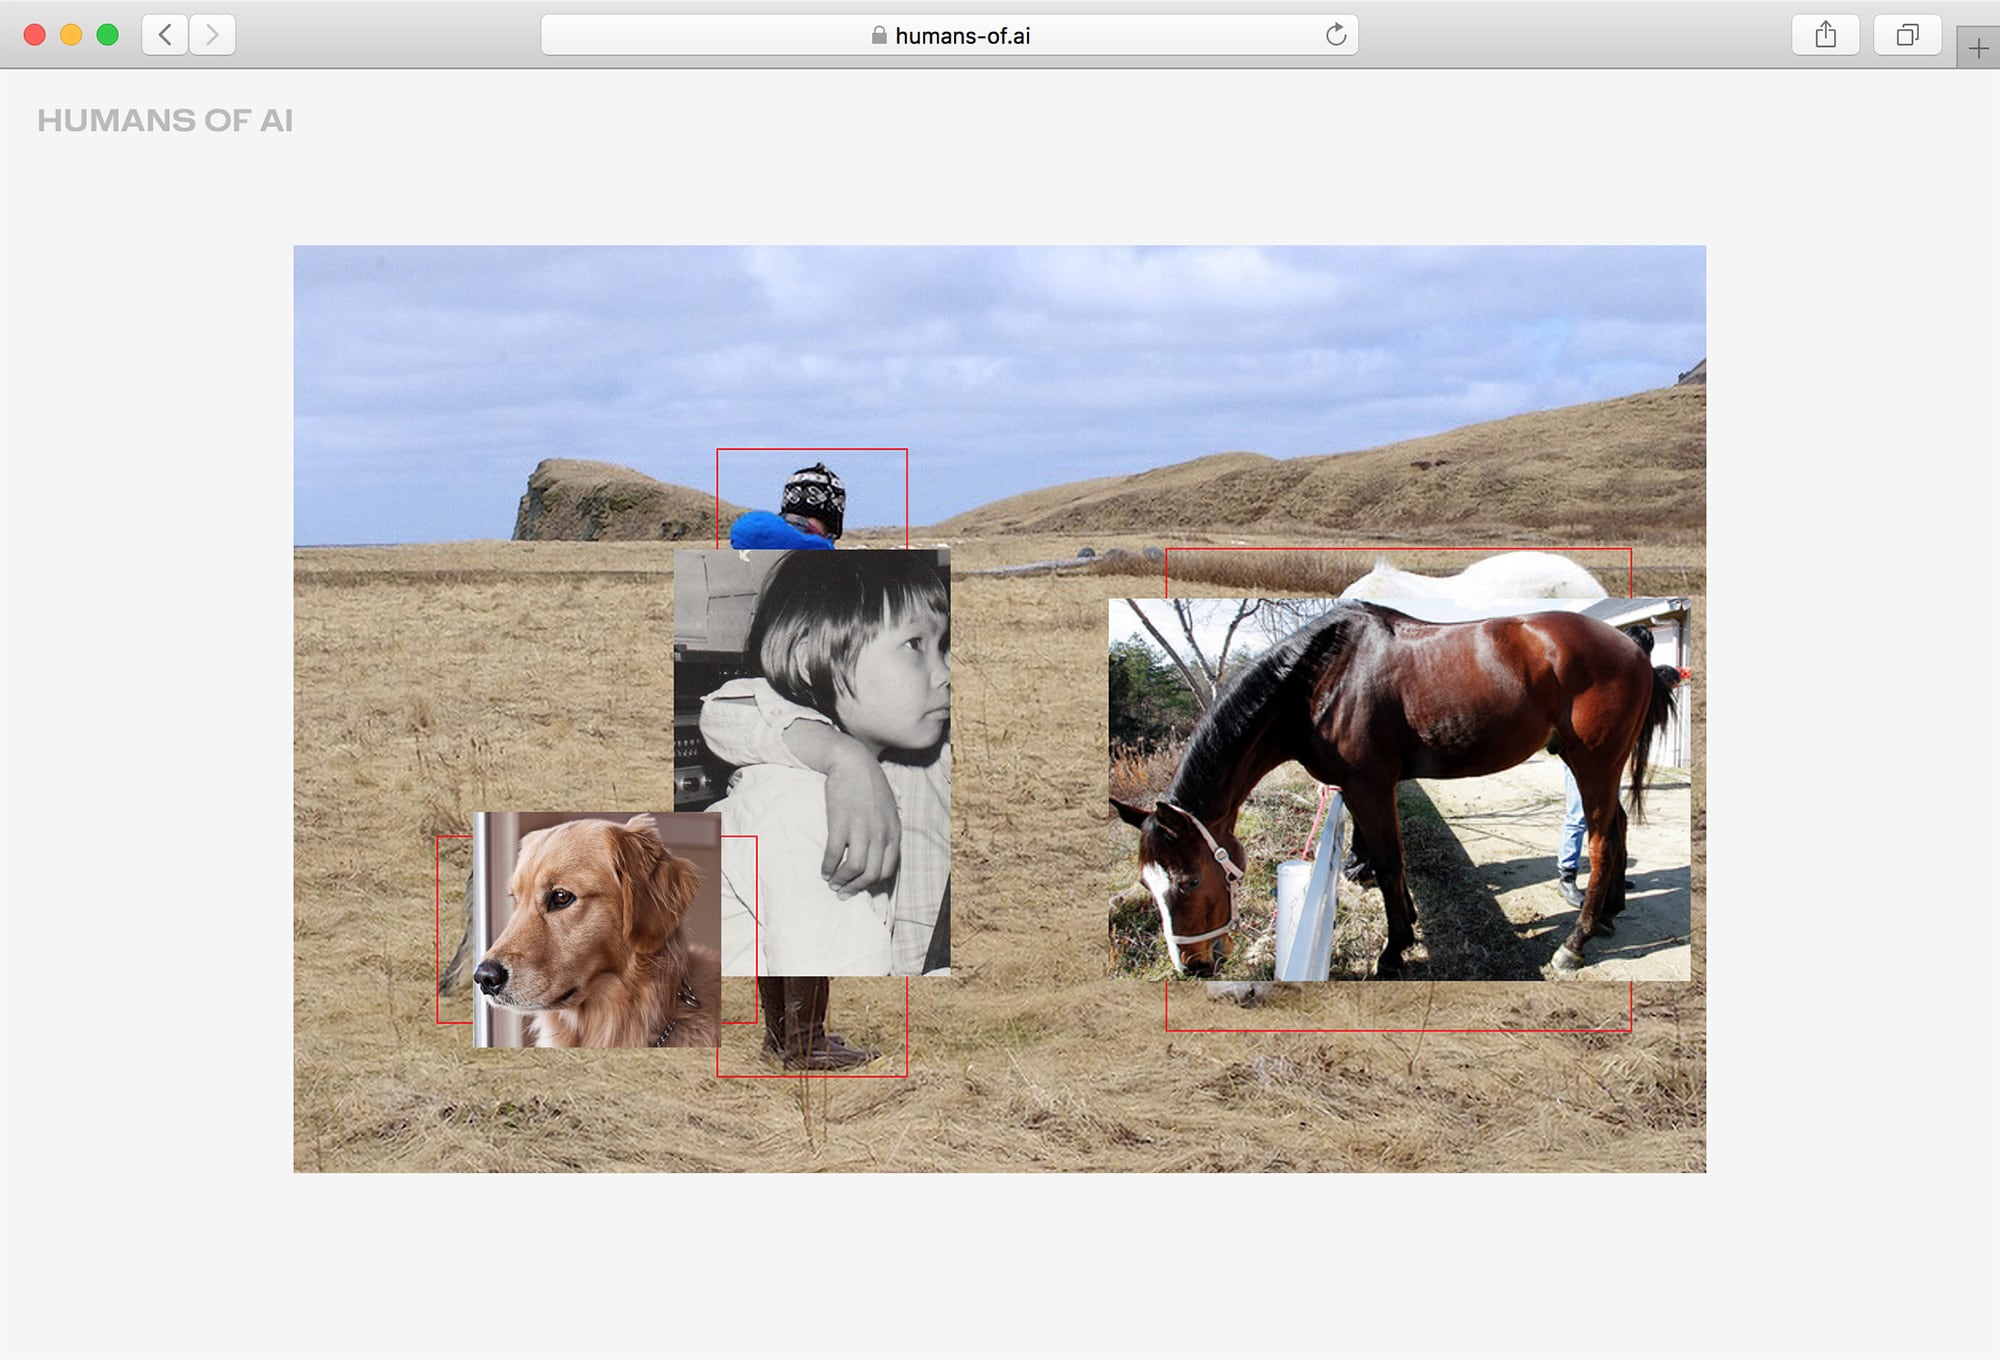
“Declassifier processes pictures using the YOLO computer vision algorithm. Instead of showing the program’s prediction, the picture is overlayed with images from COCO, the training dataset from which the algorithm learned in the first place.”

https://humans-of.ai/

Open Data Cam / moovel Lab

“‘Open Data Cam’ is a tool that helps to quantify the world. With computer vision ‘Open Data Cam’ understands and quantifies what it sees. The simple DIY setup allows everybody to become an urban data miner.”

https://lab.moovel.com/projects/opendatacam

One Two Tie My Shoe / Sonia Malpeso

“The aim of this study is to evaluate the role of the physical body within a digital working environment by examining how certain physical motions take on gestural meaning and how these motions translate into the digital gestures that they subsequently create.”

https://onetwotiemyshoe.info

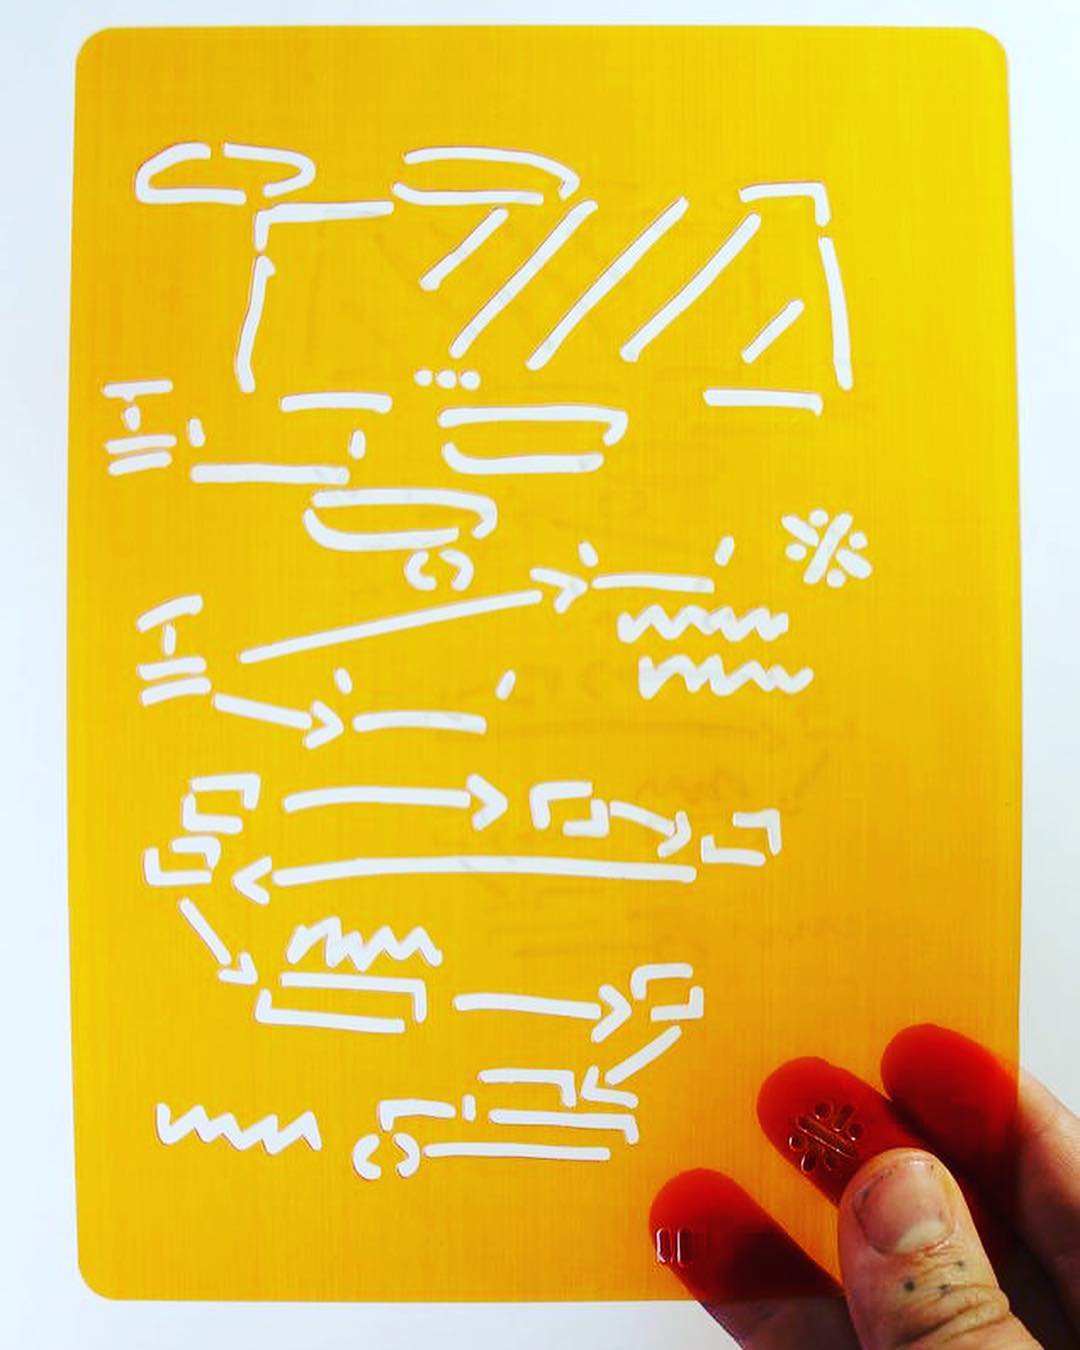
Accelerated Logic / Ryan Gandler


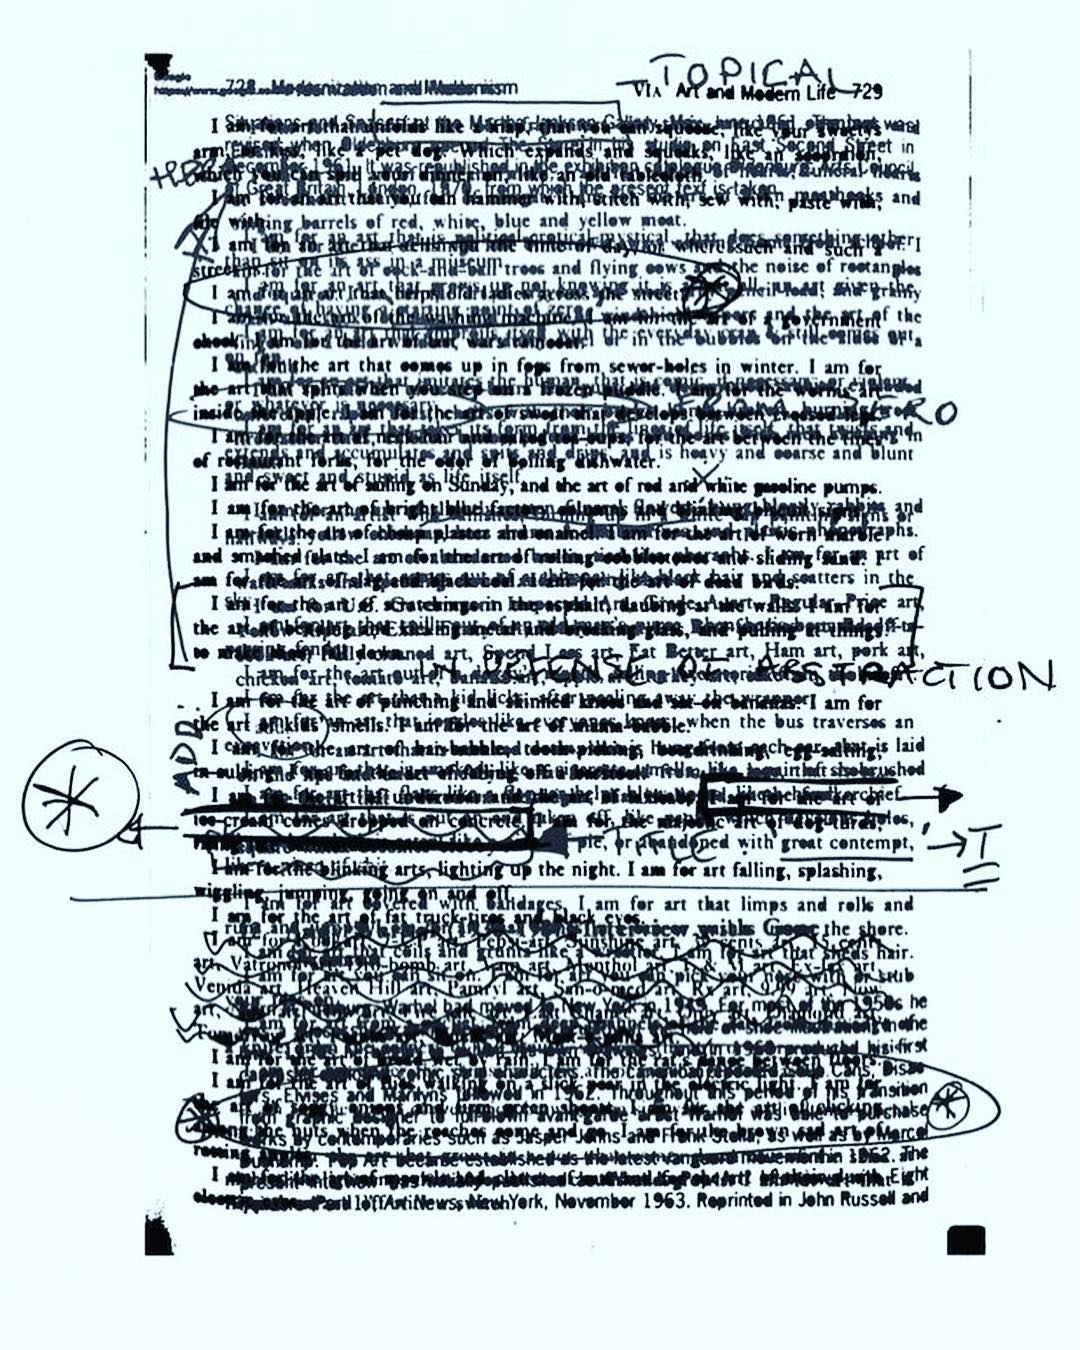
“Printed, laser die-cut orange acrylic stencil containing annotations made by the artist, to page 11 of John Berger’s Ways of Seeing. The annotations select, highlight, as well as censor the still in-print publication. Mirroring the mass production of the available book, the work considers the possible multiplication of a personal perspective through the function of the stencil.”

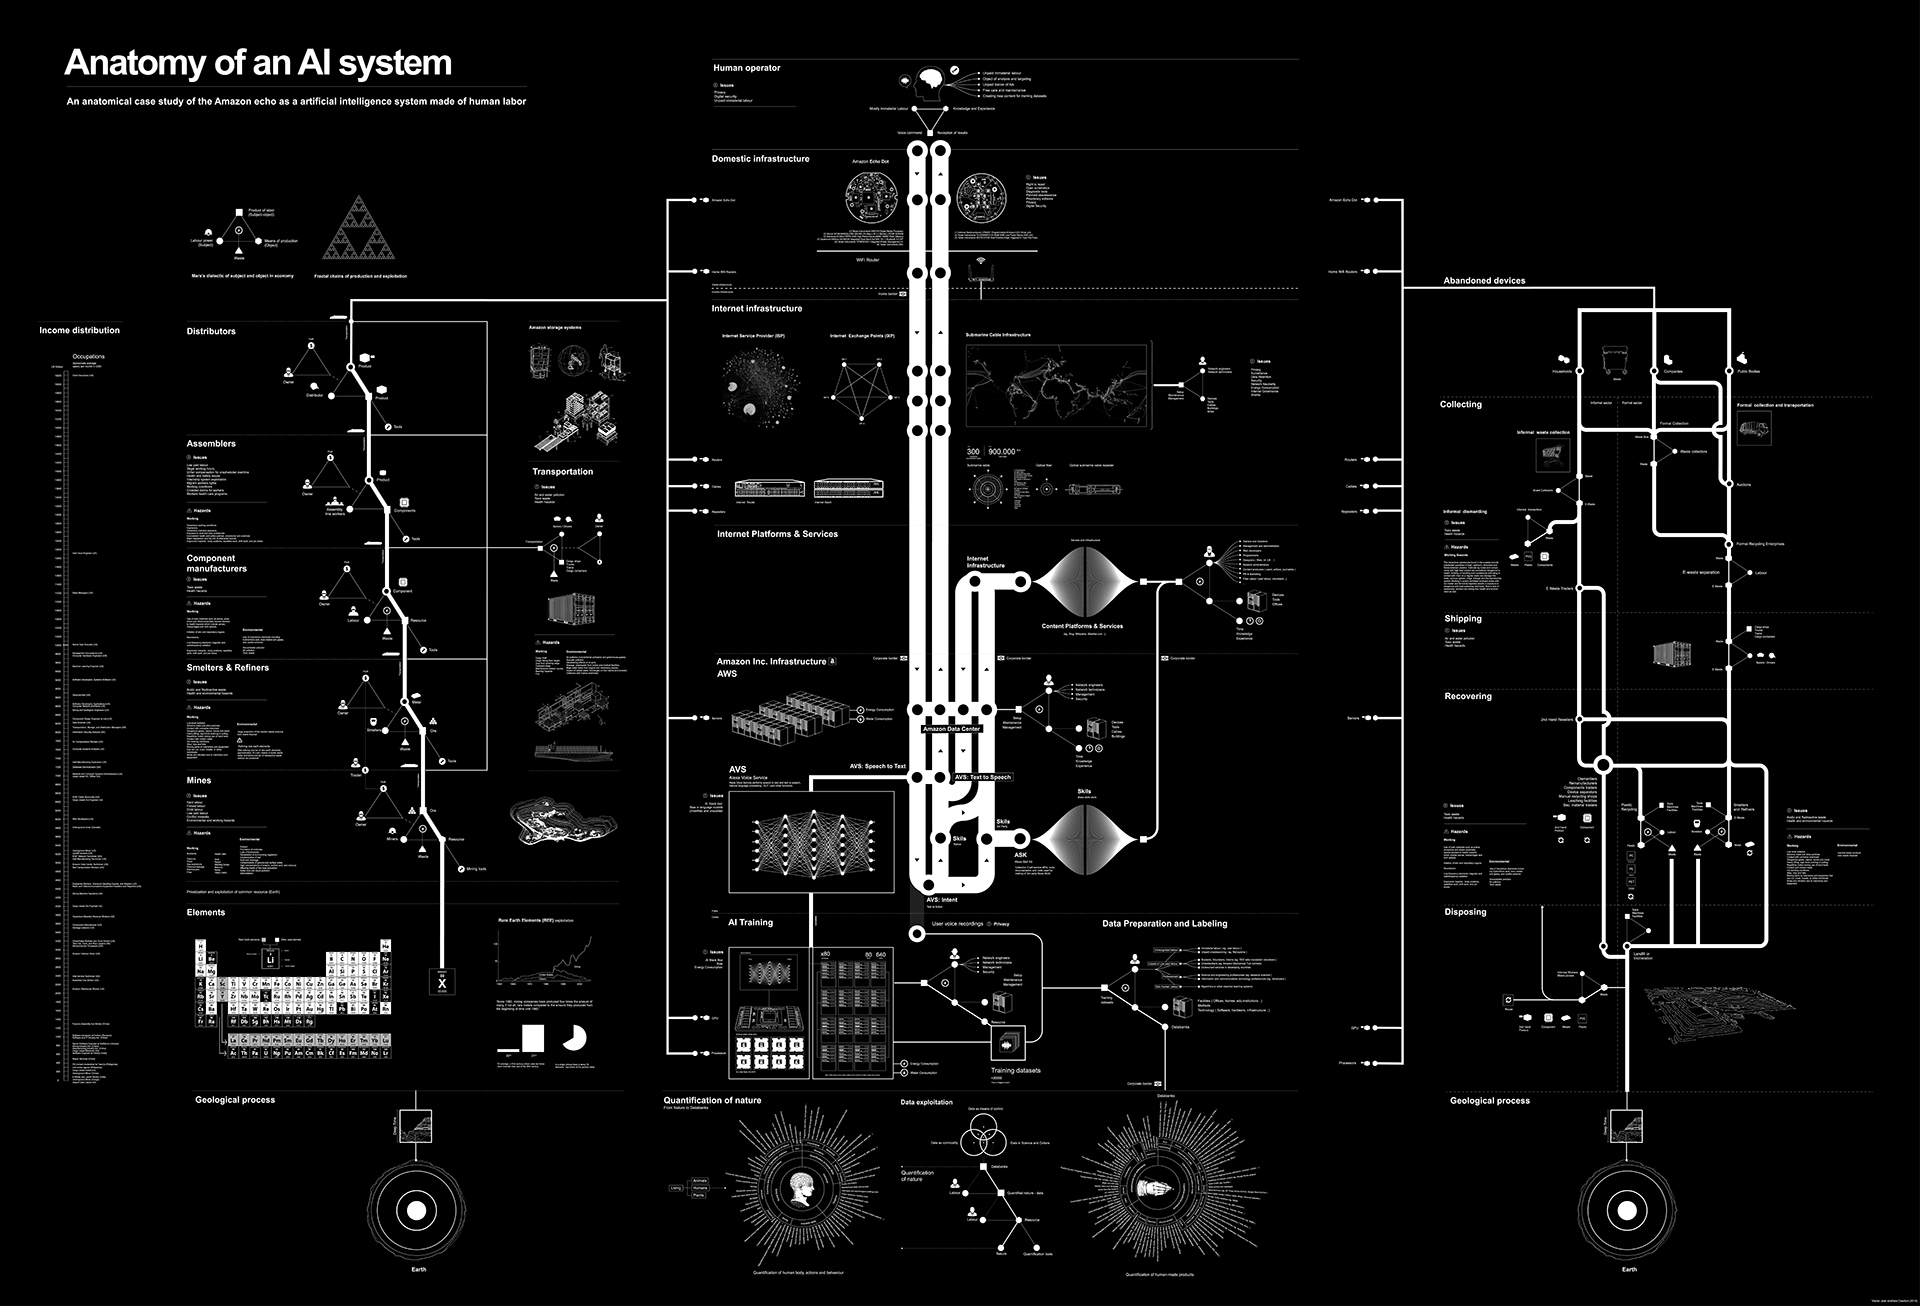
Anatomy of an AI System / Kate Crawford, Vladan Joler

The Amazon Echo as an anatomical map of human labor, data and planetary resources.

https://anatomyof.ai

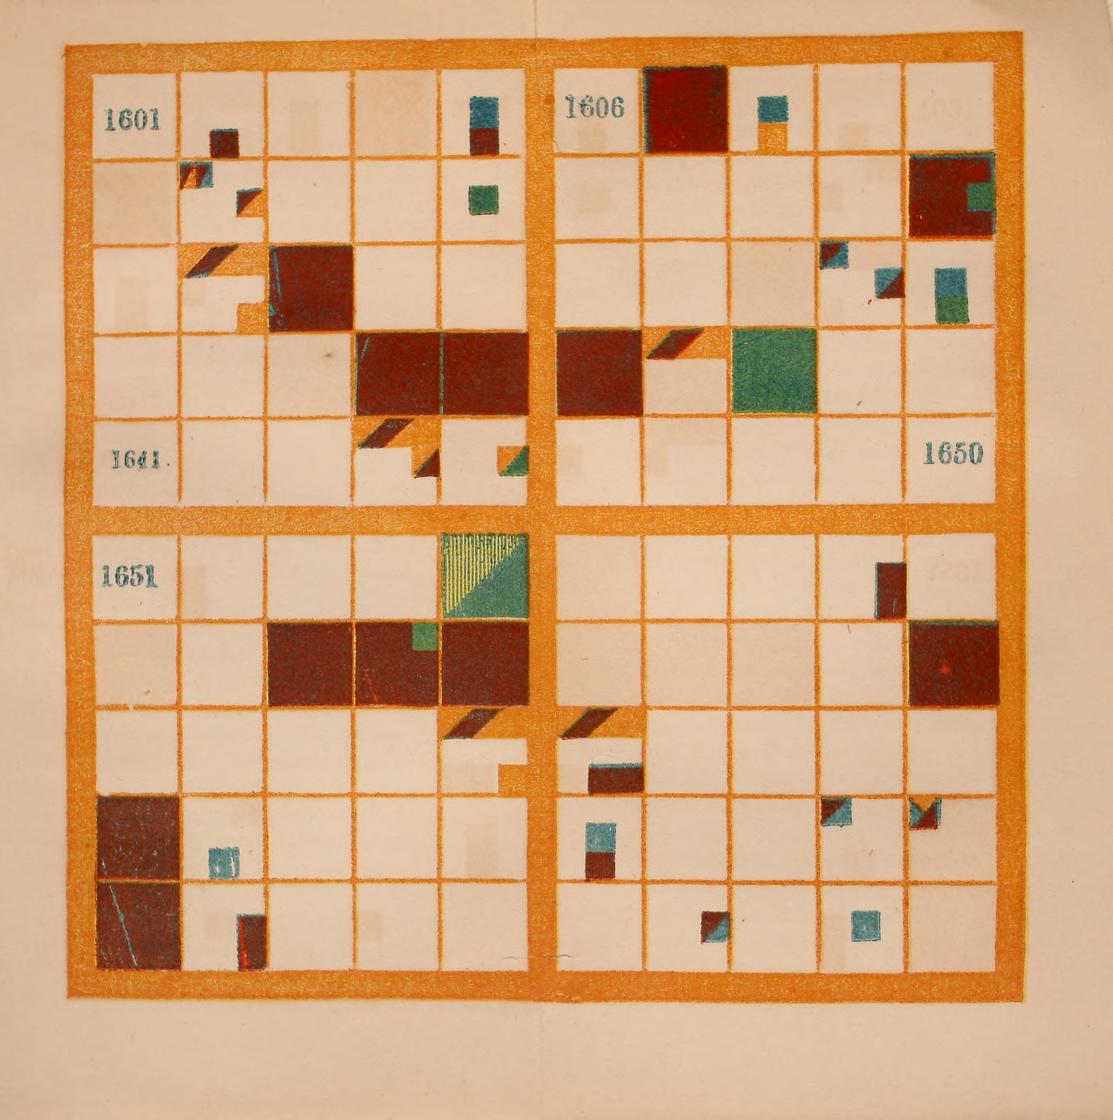
The Shape of History

“But what would it mean if we took a different view of what visualization could do? What would it mean if a visualization was designed to be difficult and abstract? If it was intended to send us back to the original source of the data in order to make sense of the image we encountered? What if the goal of visualization was to allow each person, individually, to interpret the image for herself?

This was the aim of Elizabeth Palmer Peabody, the nineteenth-century writer, editor, and educator. Inspired by a system developed in Poland earlier in the century, she devised a method of translating historical events into shape and color. In her textbook, she explained her desire to appeal to the “mind’s eye” so that each student could create a personal account of the past.”

http://www.shapeofhistory.net

Chalktalk / Ken Perlin

“Chalktalk is a digital presentation and communication language in development. Using a blackboard-like interface, it allows a presenter to create and interact with animated digital sketches in order to demonstrate ideas and concepts in the context of a live presentation or conversation.”

https://github.com/kenperlin/chalktalk
https://vimeo.com/232230096

Below the Surface – The Archaeological Finds of the North / Southline

A collection of more than 11,000 objects (of 700,000 total) found during excavations in the dried river bed of the Amstel. Photographed and sorted by date of origin (going back until 124,000 BC).

https://belowthesurface.amsterdam/

Jupyter Notebook

“The Jupyter Notebook is a web application that allows you to create and share documents that contain live code, equations, visualizations and explanatory text.”

http://jupyter.org

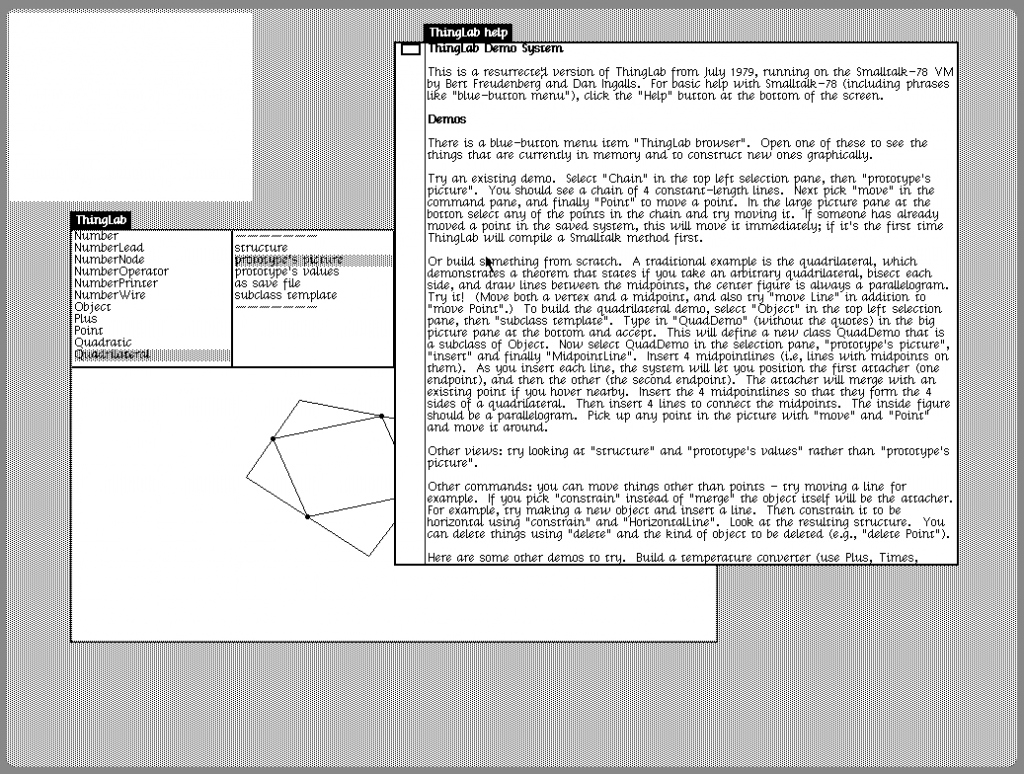
ThingLab (1978) / Alan Borning

One of the first constraint-oriented simulation programs.

Video Demo
Online Version

Critical Atlas of Internet / Louise Drulhe

“The aim of the “Critical Atlas of Internet” is to use spatial analysis as a key to understanding social, political and economic issues on Internet.”

The website also has an adaptive print layout to scale from booklet to poster in any size.

https://louisedrulhe.fr/internet-atlas/

Hamlet / Doug 50

Group project to develop a new software system based on Doug Engelbart’s ideas for the 50th anniversary of the demo of 1968.

http://ualr.edu/jdberleant/URLtable-DB.html
http://dkr.space
http://doug-50.info
http://timebrowser.info

Iller / Benjamin Maus & Prokop Bartonicek

“It is an apparatus, that sorts pebbles from a specific river by their geologic age.”

http://www.thisiscolossal.com/
http://www.prokopbartonicek.com/

Text in N-Dimensions / Xiangjun Shi Trofimov (Shixie) & Anne Burdick

“The project aims to re-invent the traditional reading interface for digital humanity scholars based on Jerome McGann’s idea: a “dynamic space that can be organized in an indefinite number of perspectives.” The idea is that the reader will be able to “wander” through a field of text content, and by taking different perspective to view this field of content, derive different threads of argumentation.”

http://www.shixie.org/project_ndtext.html

Some Digital Humanities projects (ongoing list)

The Preservation of Favoured Traces / Ben Fry
The Homer Multitext

Intro to Digital Humanities / Reader by Johanna Drucker

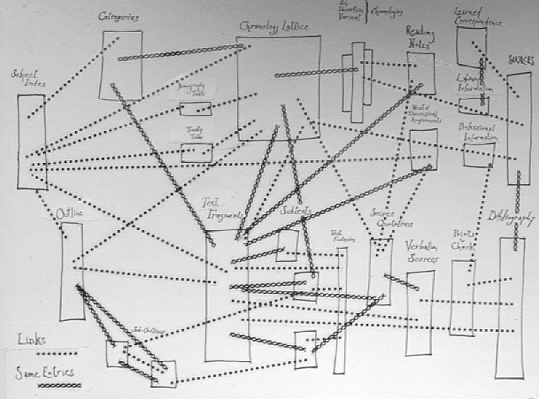
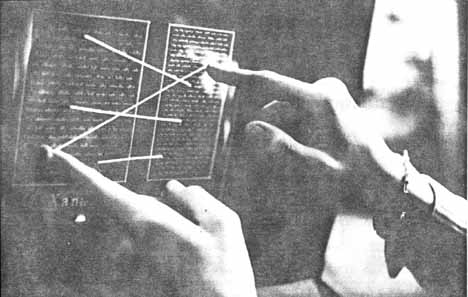
Ted Nelson / Concepts & Prototypes


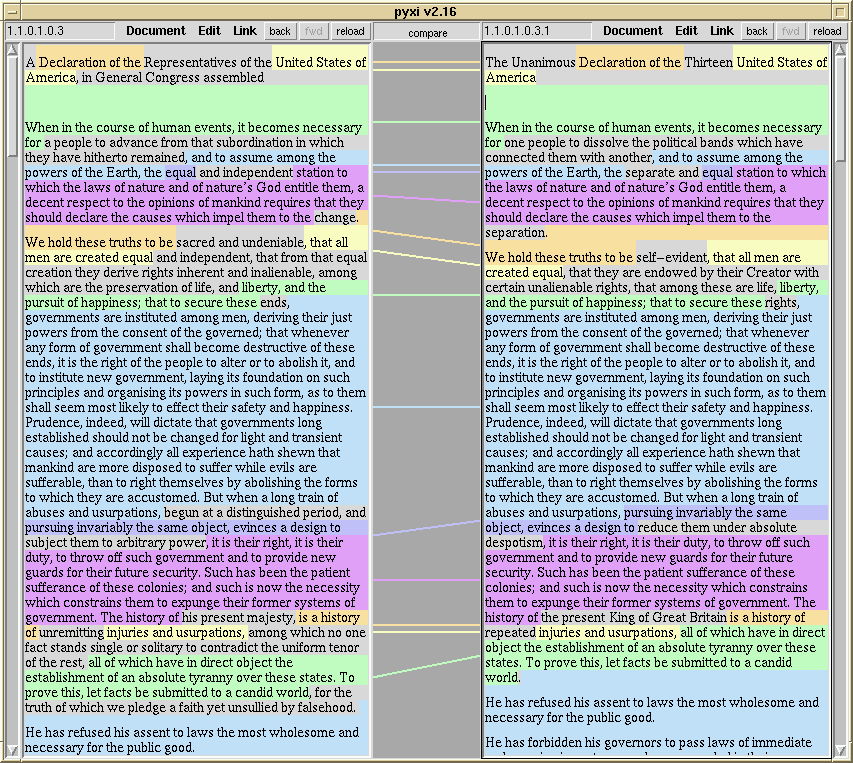
1965, Side-by-side connected comparison of parallel documents


1972, Transpointing windows


1999, PYXI viewer by Ka-Ping Yee


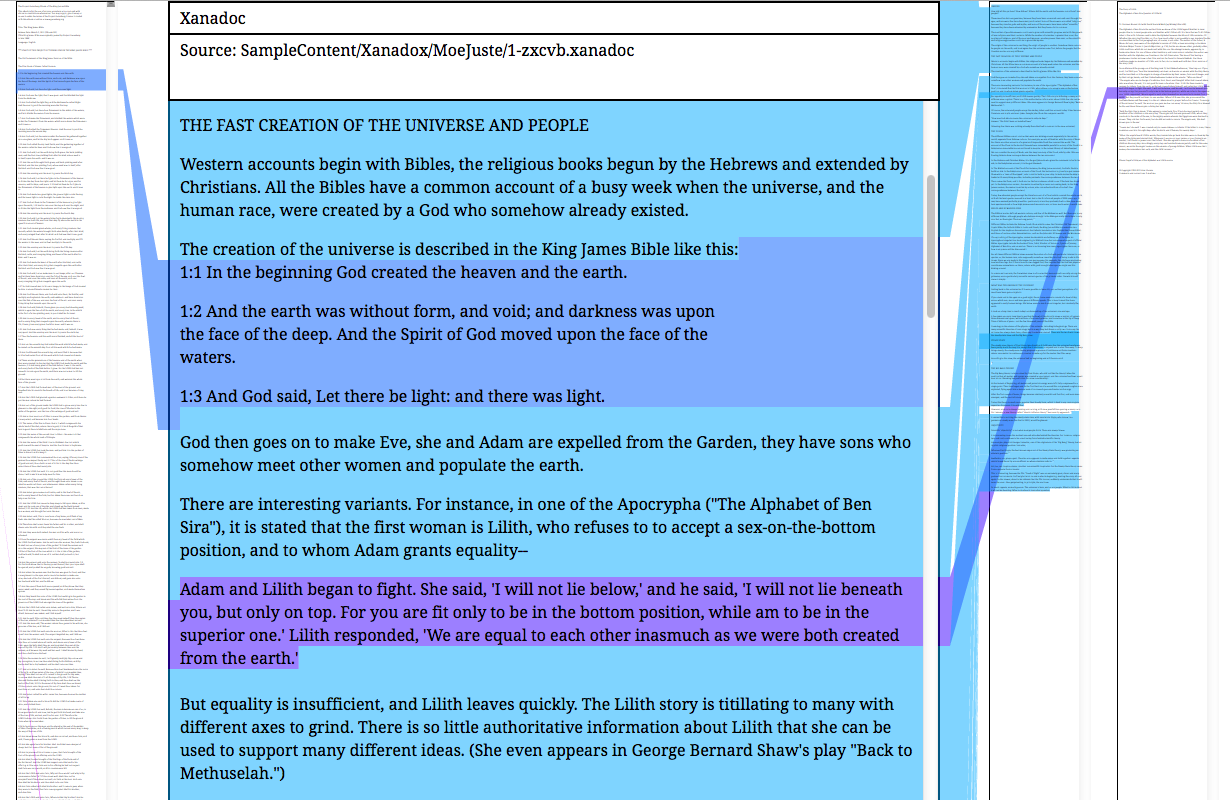
2014, OpenXanadu by Ted Nelson and Nicholas Levin

Key concepts
Xanalogical structure
Parallel documents / Transpointing windows
Annotation
Deep links
Deep versioning and re-use (transclusion)
Xanalinks
Stretchtext
Intertwingledness

Links
http://ted.hyperland.net
http://xanadu.com/xUniverse-D6
http://xanadu.com.au/ted/XUsurvey/xuDation.html
http://xanadu.com/XUarchive/htn8.tif
JS implementation of Stretchtext
ZigZag database system

Milestones in the History of Thematic Cartography, Statistical Graphics, and Data Visualization

http://datavis.ca/milestones/

Micro Visualisations / Jonas Parnow

“How can Micro Visualisations enhance text comprehension, memorability, and exploitation?”

http://microvis.info

Satelliten / Quadrature

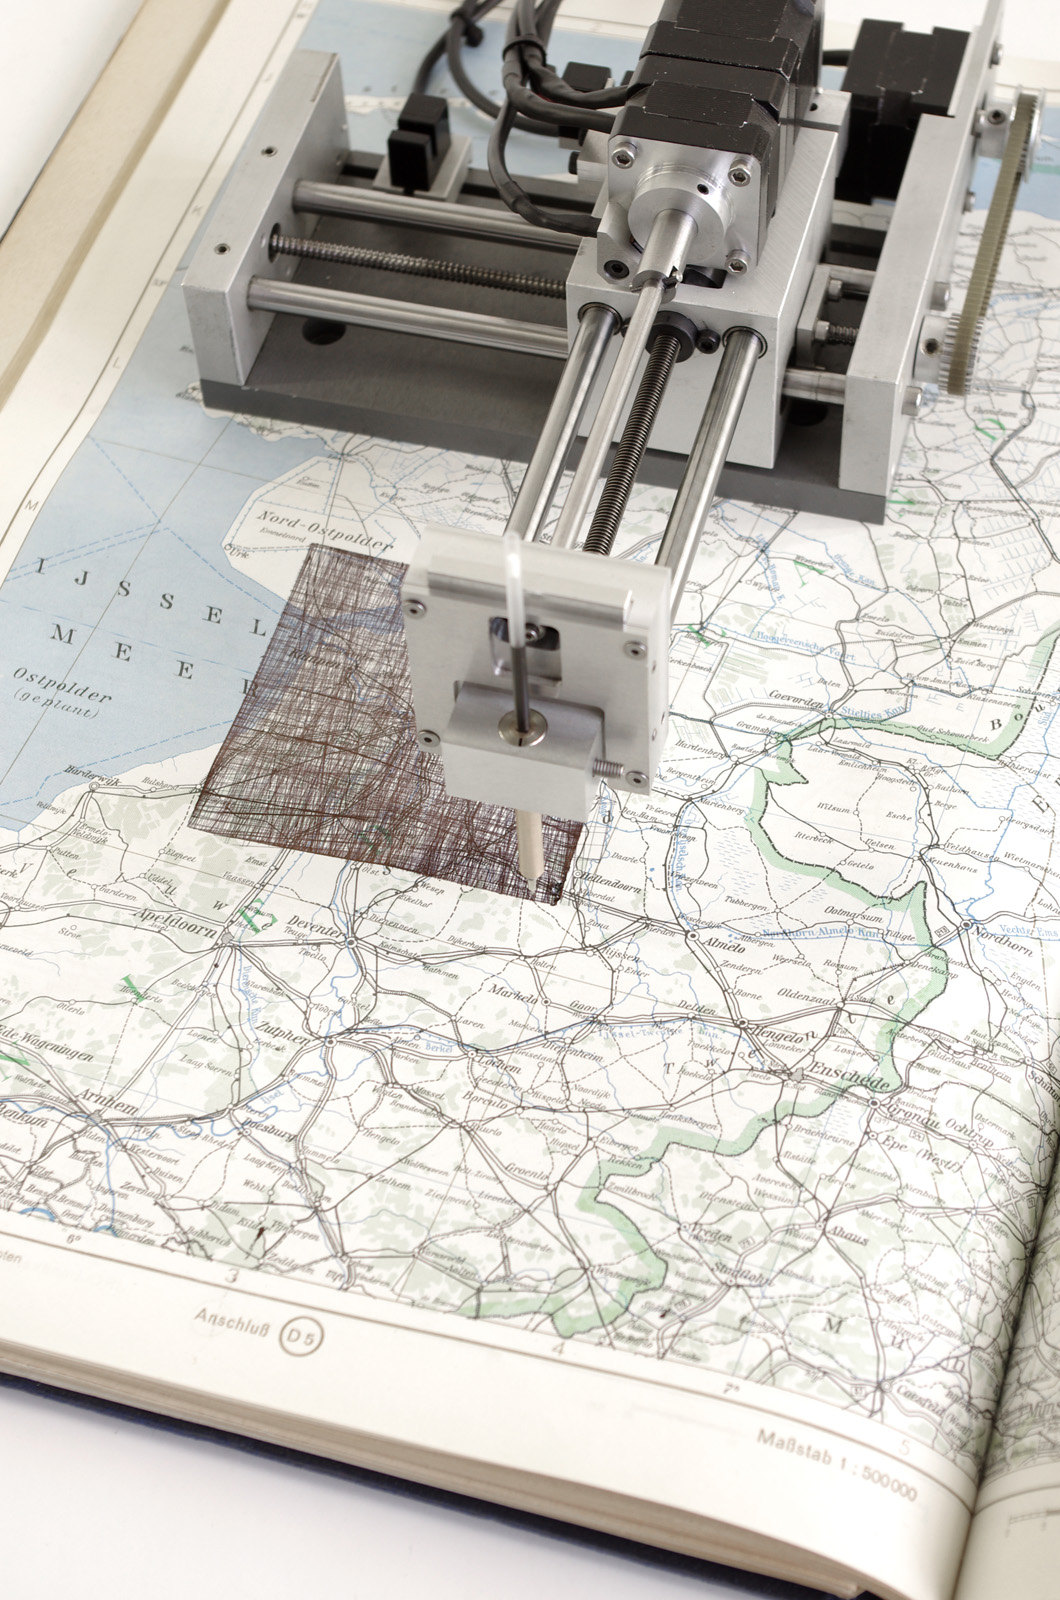
Visualization of real-time satellite movement patterns on paper maps.

http://quadrature.co/

BackStory / Floria Kräutli

Interactive tool/piece that visualizes editing processes on text archives (Wikipedia articles in this case).

projects.kraeutli.com/
www.icaphila.org/

Robot readable world / Timo Arnall

https://vimeo.com/

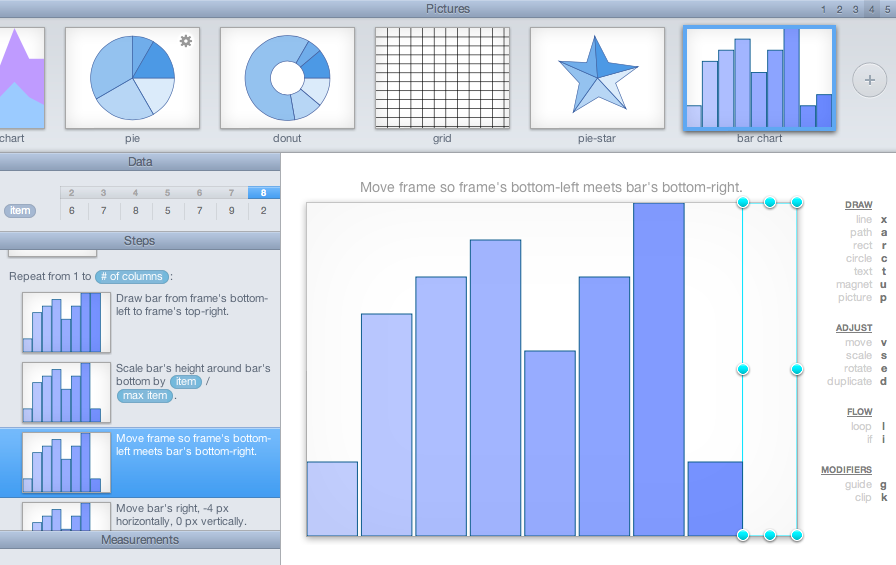
Drawing Dynamic Visualizations / Bret Victor

Talk demonstrating the concept and prototype of a software tool for creating parameterized graphics. Blend of programming and graphics.

Talk
Additional Notes

Big Data

“The Petabyte Age is different because more is different. Kilobytes were stored on floppy disks. Megabytes were stored on hard disks. Terabytes were stored in disk arrays. Petabytes are stored in the cloud. As we moved along that progression, we went from the folder analogy to the file cabinet analogy to the library analogy to — well, at petabytes we ran out of organizational analogies.

This is a world where massive amounts of data and applied mathematics replace every other tool that might be brought to bear. Out with every theory of human behavior, from linguistics to sociology. Forget taxonomy, ontology, and psychology. Who knows why people do what they do? The point is they do it, and we can track and measure it with unprecedented fidelity. With enough data, the numbers speak for themselves.”

“The End of Theory”, Chris Anderson in WIRED (+ weitere Kurzartikel zum Thema)

http://www.wired.com/
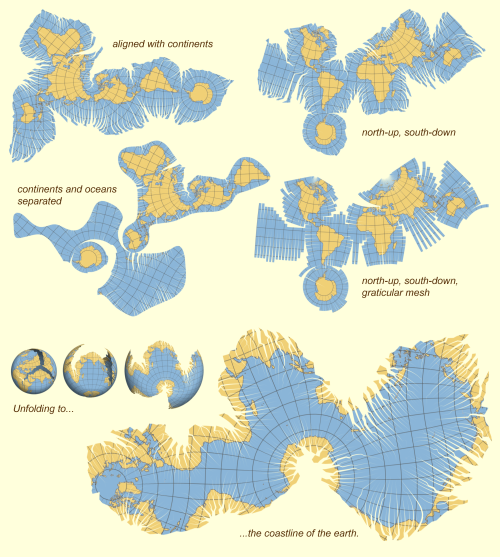
Myriahedral Projections

“A myriahedron is a polyhedron with a very large number of faces. For this reason, we call the results myriahedral projections. In step 2 and 3, this myriahedron is cut open and unfolded. The resulting maps have a large number of interrupts, but are (almost) conformal and conserve areas.”

http://www.win.tue.nl/

HyperImage

Research project about the possible role of networked images in the sciences. A system to assamble, categorise, annotate and link images wants to explore new forms of working with images in other scientific contexts than in art history. Some examples on the website.

http://www.uni-lueneburg.de/

Nubeology / Gerhard Lang


Lang explores in historical reference to Goethe and Constable cloud phenomena as artistic commentary and the question of presentability. For example his “idealized” phantom images of clouds he did with help of the “identikit machine” of the BKA or his “Cloud Walks”.

http://www.gerhardlang.com

Prototype theory / Labov Experiment

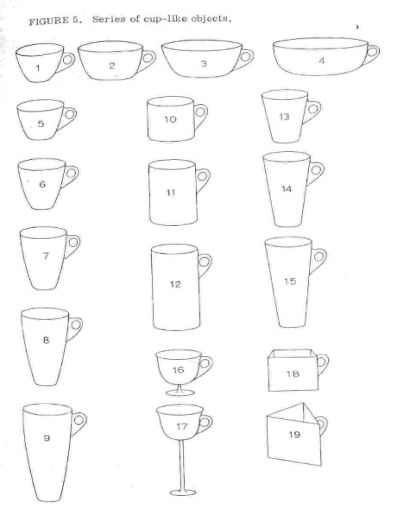
Labov investigated the borders of words and concepts and the working of categorization in everyday communication. In a study drawings of “containers” with different formal characteristics where shown to participants. They had to assign them with either “cup”, “bowl” or “vase”. The decision gradually changed when they where asked to imagine the object filled with flowers or mashed potatoes for example. The categorization seems to be context dependent and fuzzy. Prototype theory in general states that we imagine categories of things around a strong member or representative of the category. It often refers to Wittgenstein’s concept of “Familienähnlichkeit” (family likeness).

http://fak1-alt.kgw.tu-berlin.de/
http://pyersqr.org/

Visualization as tool for productivity / Let’s focus

Let’s focus is an example for a bunch of visualization tools, that should streamline and raise efficiency of communication processes in the context of management and business. The improved productivity is proofed with scientific studies (see Prof. Martin Eppler). The tool is interesting as it provides a set of (partly weird) visual metaphors that want to enable people without special “visual competence” to take structured notes of meetings e.g. Maybe the tendency to formalize and exploit a kind of visual thinking / diagrammatic reasoning for means of productivity.

http://de.lets-focus.com

Tree of Life (Hillis Plot)

A more complex diagram of evolutionary relations.

http://www.zo.utexas.edu/

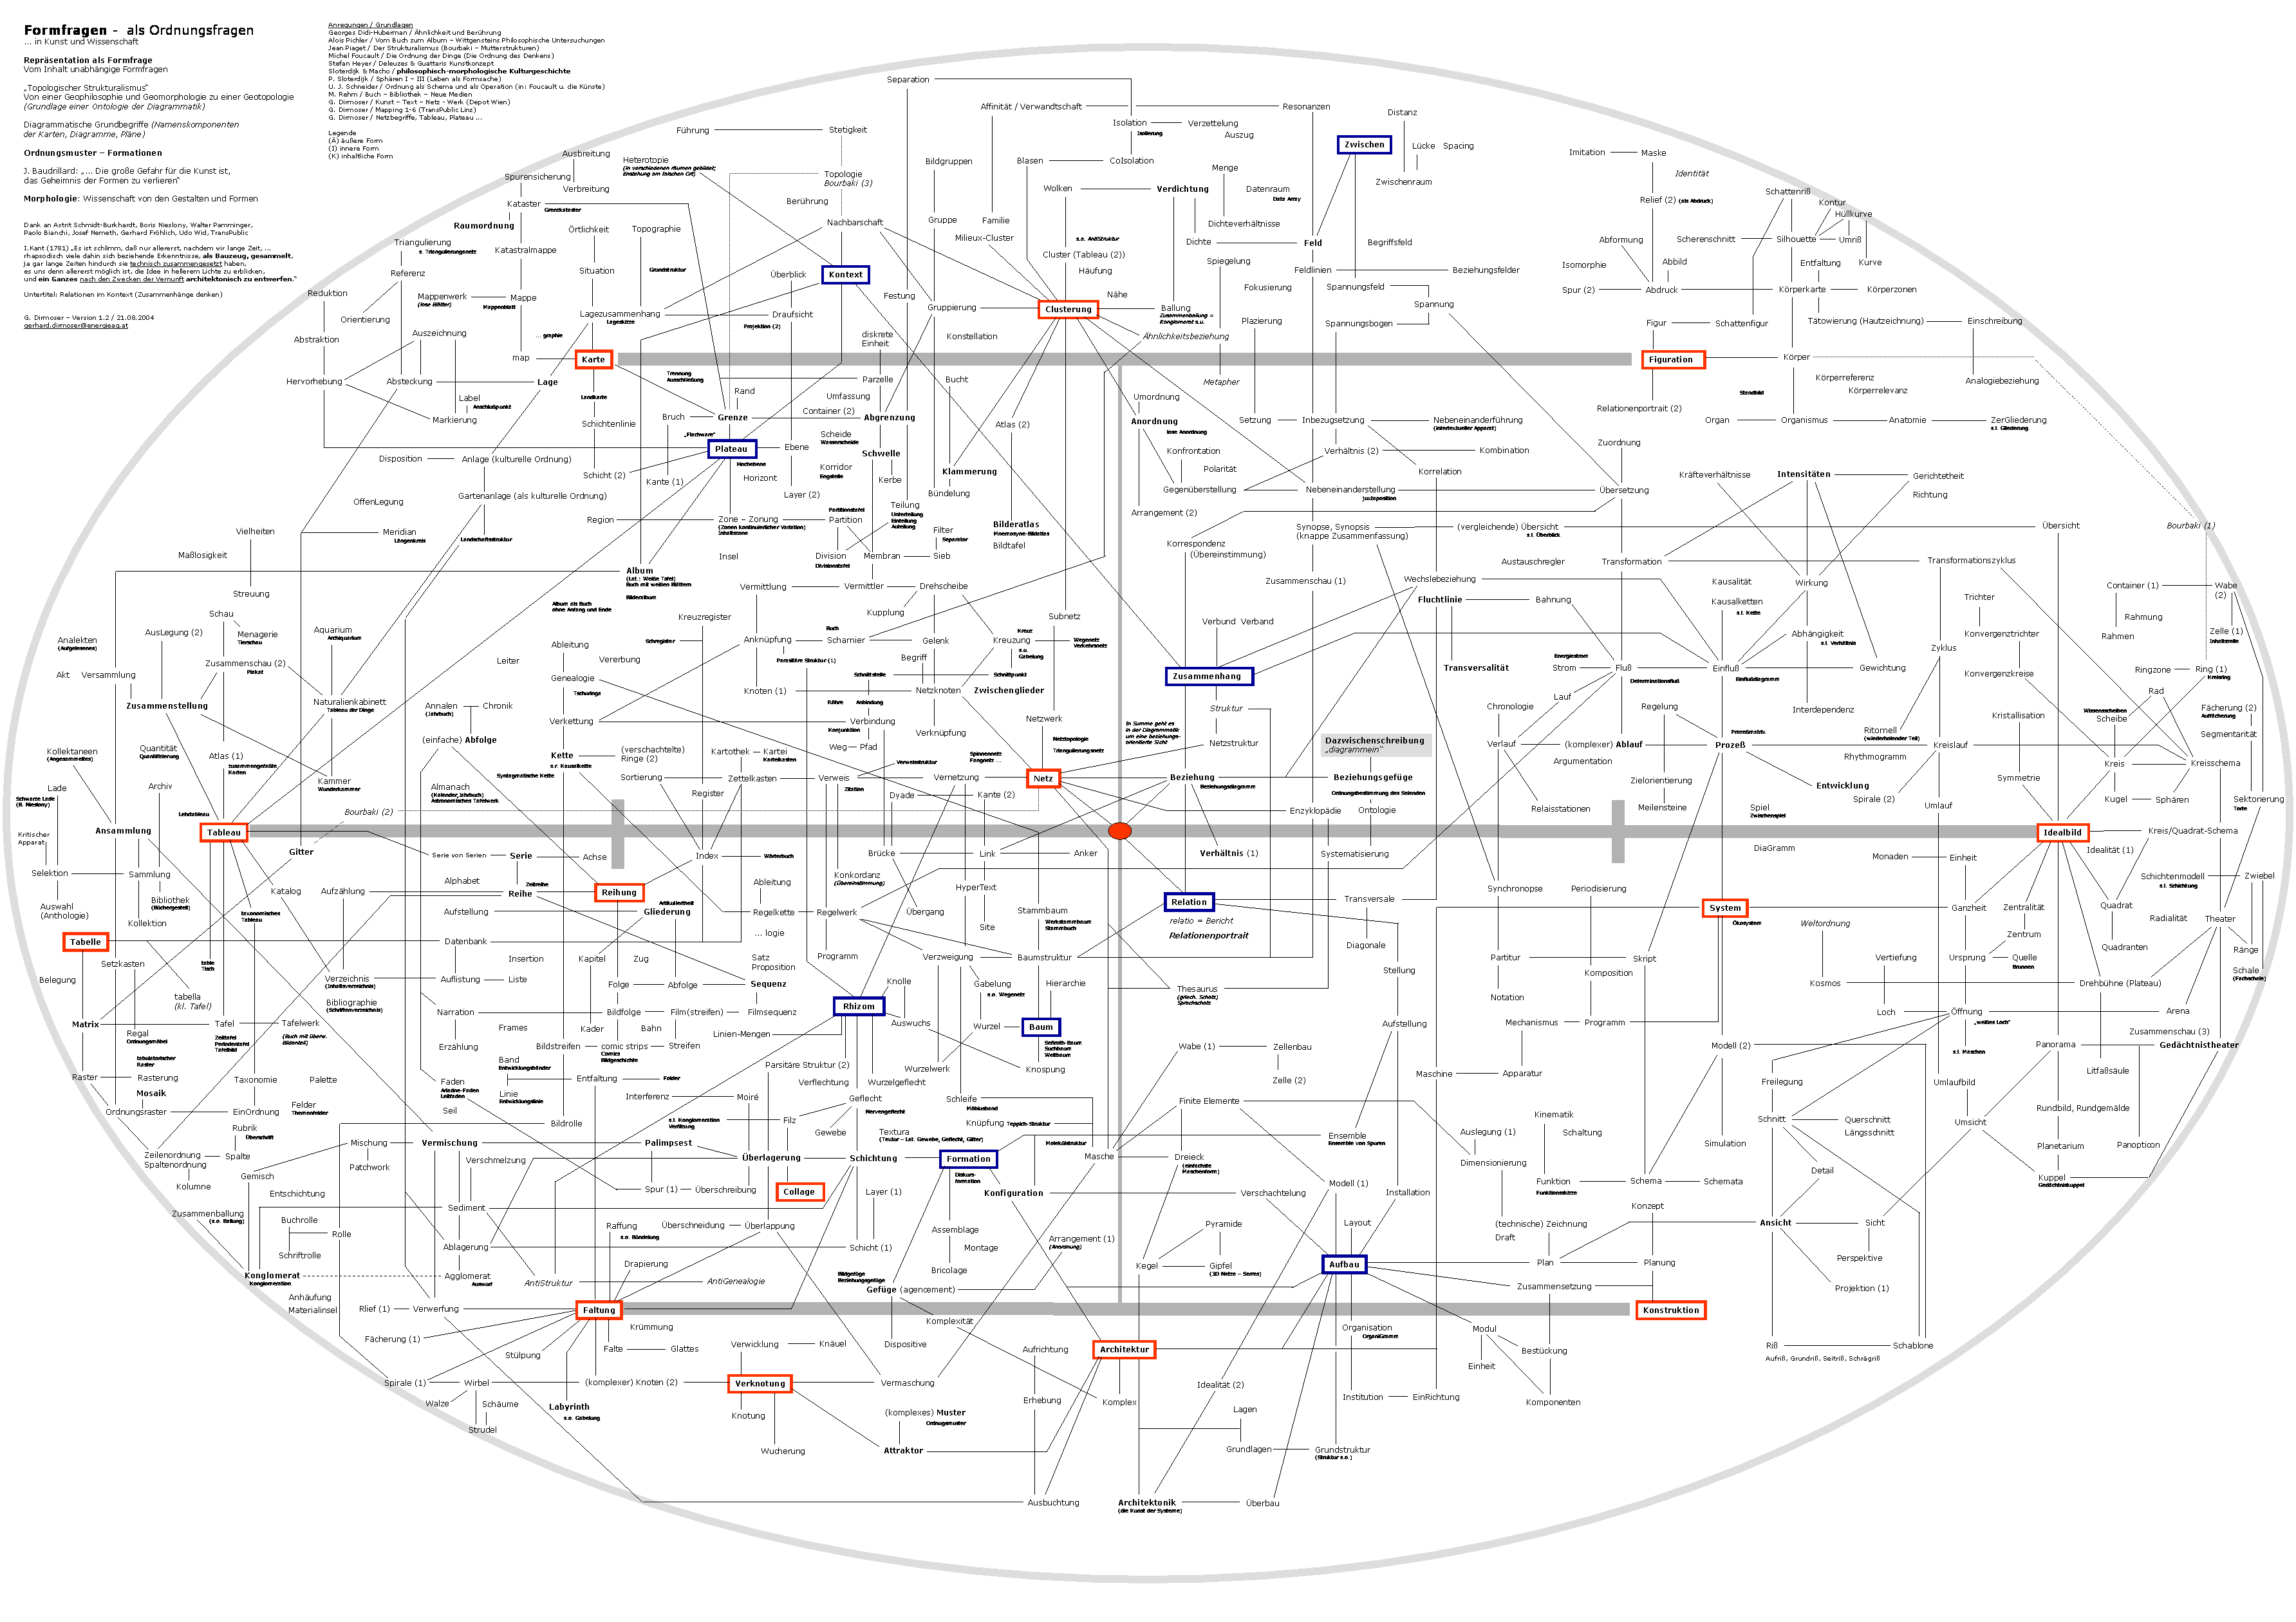
Gerhard Dirmoser

Theoretical occupation with diagrams, forms of order, forms of thinking and transformation in own diagrams.

“Formfragen als Ordnugsfragen” (PDF)
http://gerhard_dirmoser.public1.linz.at/

Visual Proof


1 + 3 + 5 + … + (2n − 1) = n^2

Diagrams and their potential to make mathematical relations evidently visible, to proof them solely (previous knowledge assumed) by visual means.

http://www.billthelizard.com/
http://mathoverflow.net/

Ricardo Basbaum

Artistic and subjective diagrams, known from the “Atlas of Transformation”.

http://monumenttotransformation.org/

The city is not a tree / Christopher Alexander

In his essay Alexander distinguishes to structural principles, the rigid “tree” and the “semilattice”, that allows for intersections between elements. He argues that people tend to reduce complex issues conceptually on trees, that it’s even impossible to think in the “semilattice”. He is concerned about the dangers of this conceptual reduction he also sees in architecture and design projects.

Part 1, Part 2

Thousand Plateaus / Marc Ngui

Illustrations to “A Thousand Plateaus” by Deleuze/Guattari. As “means of understanding of the ideas presented in the book”.

http://www.bumblenut.com/

Selective Memory Theatre / Matthias Dörfelt

The installation tries to simulate and visualize the process of memory by algorithmically combining visual material from newsfeeds.

http://www.mokafolio.de

Astrom / Zimmer


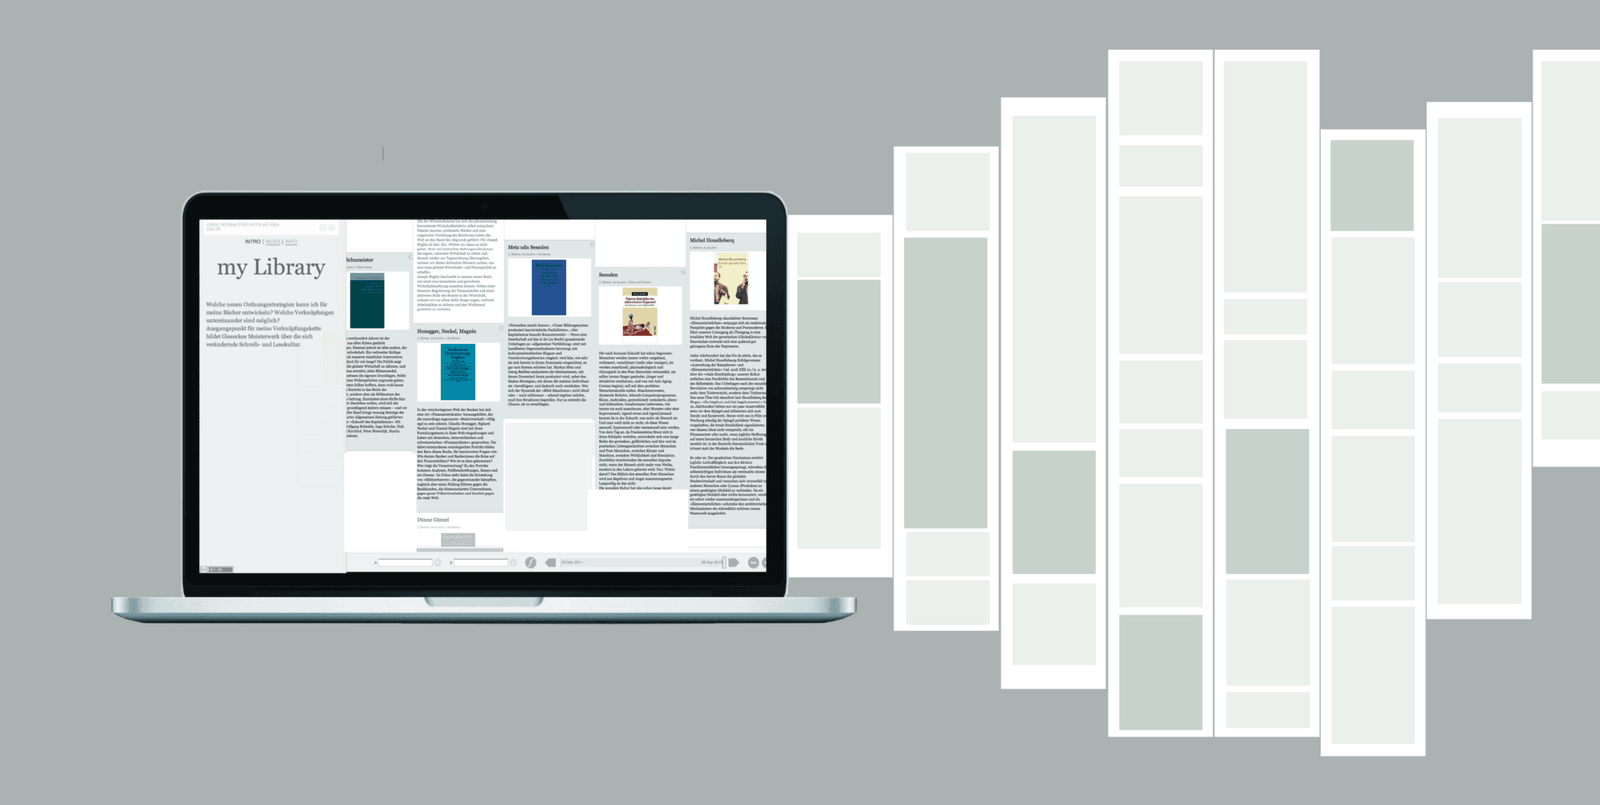
Develop tools for non-linear text production, information search and new forms of knowledge organization. They experiment with interface concepts and ways of associating information to enable new forms of dealing with knowledge, often especially personal knowledge systems.

http://astromzimmer.com

Designing Universal Knowledge / Gerlinde Schuller

http://www.theworldasflatland.net/

extracts of local distance / FELD

Algorithmically extracted and combined elements of architectural photographs creates new images/interpretations of spaces.

https://www.feld.studio/